
Stecker Machine Blog

7 Best CCK-8 Assay Kits for Cell Viability Testing

Cell viability measurements shape decisions in drug screening, toxicology, and routine cell culture. Cck-8 assays are popular because they produce a soluble color signal without a washing step. Yet a brighter well does not automatically mean more living cells. Cck-8 measures cellular metabolic activity, which can shift with cell density, treatment, and incubation time.

The wider cell-culture market provides useful context, but it is not a direct measure of CCK-8 kit sales. Grand View Research estimated the global cell-culture market at USD 27.9 billion in 2023 and projected continued growth through 2030. These figures describe a broad field, not assay-kit demand. That distinction matters. In the Assay Guidance Manual, cell-based assay scientist Terry Riss and co-authors write: “Cell viability assays are used to determine the number of living and/or dead cells in a sample.” Their definition highlights why assay choice and validation matter.

This guide compares seven CCK-8 assay kits by signal performance, protocol clarity, compatibility, and practical handling. It considers details that affect real bench work, such as edge-well variation, plate format, and reagent stability. A kit may look excellent on paper. Your cells may disagree. Results should be checked against appropriate controls and, where needed, an independent readout. No single kit suits every cell line or experimental question. The comparison is a starting point, not a substitute for validation in your own model.
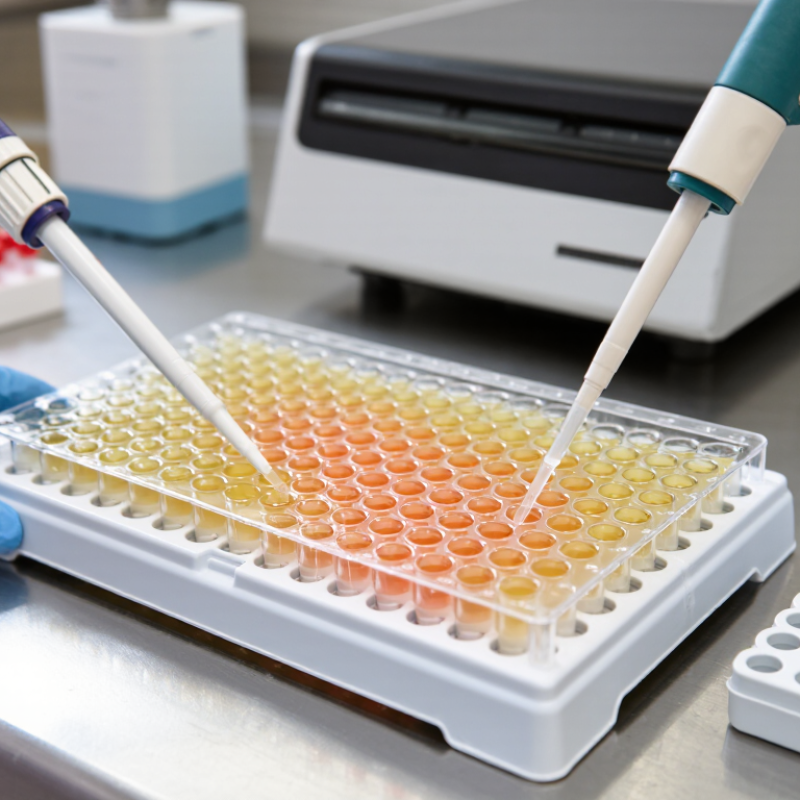
7 Best CCK-8 Assay Kits for Cell Viability Testing

How CCK-8 Assays Measure Cell Viability

CCK-8 assays estimate cell viability through a color-producing chemical reaction. The reagent contains WST-8, a tetrazolium salt that living cells reduce through cellular dehydrogenase activity, with help from electron-transfer compounds. This reaction produces orange, water-soluble formazan in the culture medium. More color often indicates more metabolically active cells. Not a direct count. A plate reader measures absorbance, commonly near 450 nm.

The signal is useful, but it needs careful interpretation. Drug exposure, nutrient stress, or other metabolic changes can alter the color even when cell numbers barely shift. A stronger signal does not automatically mean more cells. Include untreated controls and reagent-only blanks to assess the response and background. Test a range of cell densities, too; crowded wells may saturate the signal, while sparse wells can sit near background. Keep incubation times consistent, since color can continue developing.

In practice, even seeding matters. Replicate wells can reveal uneven cell distribution, a small but common source of confusing results. Avoid bubbles in the optical path, and check that the chosen reading time fits the cells and experimental conditions. Interpret the measurement as metabolic activity under those conditions, rather than proof that every cell is alive. That distinction is easy to overlook.

How CCK-8 Assays Measure Cell Viability

CCK-8 reagent is reduced by cellular dehydrogenases in metabolically active cells, producing a soluble colored product measured by absorbance, commonly at 450 nm. The example below shows illustrative normalized results; actual readings depend on cell type, assay conditions, and background correction.

Interpretation: Relative viability is typically calculated as (treated-well absorbance minus blank) ÷ (control-well absorbance minus blank) × 100. A lower signal can indicate fewer viable cells or reduced metabolic activity.

Key Criteria for Choosing a CCK-8 Assay Kit

A useful CCK-8 kit should fit your cell type, plate format, and expected cell number. The assay measures WST-8 reduction, producing a colored, water-soluble product that can be read near 450 nm. This is convenient. But signal reflects metabolic activity, not cell count alone. Check that the kit’s stated linear range covers your planned seeding density, and verify it with a small pilot experiment.

Review the incubation time, reagent volume, and recommended reader settings. Shorter incubation may suit dense cultures; sparse wells may need more time. Include blank wells with medium and reagent, plus untreated and treated controls. These reveal background and help distinguish a treatment effect from ordinary variation. Also check whether the protocol supports your vessel type. A detail easily missed: colored compounds or reducing agents in the sample may affect absorbance.

Storage conditions, shelf life, and pack size matter when experiments run across several weeks. Compare the number of tests with your replicate plan, not just the listed price. Look for clear instructions on handling edge wells and reporting results. I would still test performance in your own cells; published ranges may not transfer neatly. A careful pilot can expose that mismatch early.

Seven CCK-8 Kits Compared by Features and Applications

Seven CCK-8 kits differ less by the basic WST-8 chemistry than by sensitivity, format, and workflow. A standard microplate kit suits routine viability curves. A high-sensitivity format can help when cell numbers are low. A rapid-read option may shorten incubation, but signal still depends on cell type and metabolic state. For suspension cells, check whether the protocol supports reliable mixing and sampling. High-throughput formats prioritize plate compatibility and repeatable dispensing. Low-interference formulations may be useful with colored or chemically active treatments. A broad-use kit offers flexibility, though it may not be optimized for any one model.

Compare practical details before choosing: recommended cell density, working volume, incubation range, wavelength, and storage stability. WST-8 produces a water-soluble colored product, so no crystal-dissolving step is usually needed; Ishiyama and colleagues described this chemistry in Talanta (1997). Still, a stronger signal does not automatically mean more cells. Metabolic changes can shift absorbance. Include untreated controls, blanks, and a dilution series, especially with unfamiliar compounds. Small wells can also evaporate at the edges.

For cytotoxicity interpretation, ISO 10993-5:2009 treats a viability reduction greater than 30% versus the control as evidence of a cytotoxic effect. That threshold is useful context, not a substitute for study-specific controls. The “best” kit is therefore the one validated for the cell type, plate format, and treatment being tested. It is easy to overlook the last part.

A Step-by-Step Workflow for CCK-8 Cell Viability Testing

CCK-8 viability testing works best when the workflow stays consistent from plate preparation to absorbance reading. Use healthy, actively growing cells and prepare a single-cell suspension. Check for clumps. Seed equal volumes into a clear 96-well plate, with replicate wells for each condition. Include untreated controls, medium-only blanks, and several treatment concentrations. Edge wells may evaporate faster, so fill unused wells with sterile buffer when appropriate. Allow cells to attach or recover under their usual culture conditions before treatment.

After treatment, add the water-soluble CCK-8 reagent according to the kit instructions. Avoid bubbles, which can distort optical readings. Incubate the plate at 37°C, away from unnecessary light. Timing matters. Begin with the recommended interval, then confirm that the signal remains within the reader’s linear range. Measure absorbance at 450 nm and use blank wells to correct background. Calculate viability relative to untreated controls, and report replicate variation alongside the average. A single reading may hide uneven seeding or compound interference. If results look unusual, repeat the experiment and test cell-free treatment wells. Skipping that check is an easy mistake, and it can cost valuable time.

How to Interpret Results and Avoid Common Assay Errors

CCK-8 results reflect cellular metabolic activity, not a direct count of living cells. In many assays, viable cells convert the reagent into a colored product measured near 450 nm. A darker signal often indicates greater activity, but it does not prove that cell numbers increased. Some treatments change metabolism before they affect survival. Keep that distinction in mind.

For a reliable comparison, include untreated cells, reagent-only blanks, and suitable treatment controls. Subtract the blank signal, then compare treated wells with the control using consistent conditions. Check that readings fall within the kit’s linear range; very dense cultures can produce misleadingly high signals. Use replicate wells, and inspect the plate for bubbles or uneven color. Small details matter. Even a short incubation difference can shift the reading.

If edge wells look different, evaporation or temperature variation may be involved. Avoid relying on one time point when treatment effects are unclear; a small time-course can reveal whether the signal is changing. Pilot the cell density and incubation period for your own cell type rather than copying a published setup exactly. That takes extra work. It is also easy to overlook how much cell handling varies between experiments, so record those conditions and repeat the assay before drawing a firm conclusion.

7 Best CCK-8 Assay Kits for Cell Viability Testing - How to Interpret Results and Avoid Common Assay Errors

Selection Profile Suitable Use Practical Setup How to Interpret the Readout Key Checks and Limitations
1. General-purpose CCK-8 format Routine viability or cell-proliferation measurements in established cell lines. Choose a kit with instructions and reagent volume appropriate for the plate format. CCK-8 uses WST-8, which is reduced by cellular dehydrogenase activity to a water-soluble colored formazan product. Absorbance is commonly measured near 450 nm. Within a validated range, a higher blank-corrected signal indicates greater cellular reducing activity. The signal reflects metabolic activity, not a direct count of live cells. Establish a cell-number and incubation-time range for each cell type.
2. Small-volume plate format Experiments using 96-well or other small-volume microplates. Confirm that the instructions specify compatibility with the intended plate and reader. Keep cell suspension and reagent volumes consistent across wells. Compare treated wells with matched vehicle controls after subtracting the appropriate background. Unequal volumes, bubbles, edge effects, and inconsistent mixing can change optical readings. Use replicate wells and avoid reading wells with visible bubbles.
3. High-throughput screening format Compound screens or experiments with many treatment conditions. Use a protocol that fits the plate layout and workflow. Include untreated or vehicle controls, a cell-free reagent blank, and suitable positive and negative controls. Normalize responses to the control wells on the same plate; inspect replicate variability before ranking treatments. Plate position, dispensing timing, and evaporation can create systematic differences. Keep handling order consistent and distribute controls across the plate where practical.
4. Low-cell-number profile Experiments with limited sample material or low cell seeding densities. Run a cell-number titration and test more than one reagent incubation time before the main experiment. Use the lowest cell density only if its signal is reliably above the blank and remains distinguishable from neighboring cell-number levels. At low cell numbers, background and reader variation can dominate. Do not assume that a longer incubation will improve sensitivity without also checking signal linearity.
5. Drug-response testing profile Assessing cellular responses to compounds, dose ranges, or treatment durations. Include cell-free wells containing each compound and assay reagent, as well as vehicle-treated cells. Keep solvent concentration consistent across treatment groups. A decrease in normalized signal may indicate reduced cell number or reduced cellular metabolic activity; it does not by itself prove cell death. Colored, turbid, fluorescent, or chemically reducing compounds may affect the readout. Confirm important findings with an orthogonal method when mechanism or cell death must be established.
6. Primary or metabolically sensitive cell profile Primary cells or cell types that respond strongly to handling, nutrient changes, or incubation conditions. Follow the cell type’s established culture conditions and minimize changes in temperature, medium, and handling time between wells. Interpret results against matched controls prepared and treated in the same way; compare only measurements collected under equivalent conditions. Changes in metabolism can alter CCK-8 signal without a proportional change in cell number. Validate assay conditions with an independent cell-count or viability method if needed.
7. 3D culture or organoid profile Three-dimensional cultures where reagent access and optical properties can differ from monolayer cultures. Confirm that the protocol has been validated for the model. Assess reagent incubation and mixing using the same matrix, culture format, and sample dimensions as the study. Use matched 3D controls and interpret the signal as an assay response, not as a direct measure of the number of viable cells throughout the structure. Diffusion, matrix background, and sample geometry may affect signal generation or absorbance. A 2D-validated incubation time may not be suitable for a 3D model.

Result interpretation and error prevention: Subtract a cell-free reagent blank from sample readings, and use a consistent reference-wavelength correction only when supported by the assay instructions and reader setup. Measure absorbance near 450 nm, while following the specific kit protocol for wavelength and incubation. Verify that signal is proportional to cell number over the range used, avoid comparing different cell types as if their metabolic activity were equivalent, and include controls for compounds or media components that may contribute to background.

Article Source: